Australian illustrative examples for not-for-profit public sector entities
These illustrative examples accompany, but are not part of, AASB 13. They illustrate aspects of Appendix F Australian implementation guidance for not-for-profit public sector entities in AASB 13, but are not intended to provide interpretative guidance.
The IASB published Illustrative Examples accompanying IFRS 13 Fair Value Measurement, which are available on the AASB website. Those IASB examples illustrate aspects of IFRS 13 but are not intended to provide interpretative guidance. Those examples portray hypothetical situations illustrating the judgements that might apply when an entity measures assets and liabilities at fair value in different valuation situations. The following examples illustrate aspects of Appendix F Australian implementation guidance for not-for-profit public sector entities in AASB 13. They complement the IASB’s Illustrative Examples.
IE1
The following examples portray hypothetical situations. They are intended to illustrate how a not-for-profit public sector entity might apply some requirements of AASB 13 Fair Value Measurement to particular types of assets, on the basis of the limited facts presented. Although some aspects of the examples might be present in actual fact patterns, all relevant facts and circumstances of a particular asset would need to be evaluated when applying AASB 13. The evaluations in each example are not intended to represent the only manner in which AASB 13 could be applied
Fair value of a non-financial asset not held primarily for its ability to generate net cash inflows and measured under the cost approach
Nature of costs included in the replacement cost of a reference asset (paragraphs F9(a) and F11–F15)
IE2
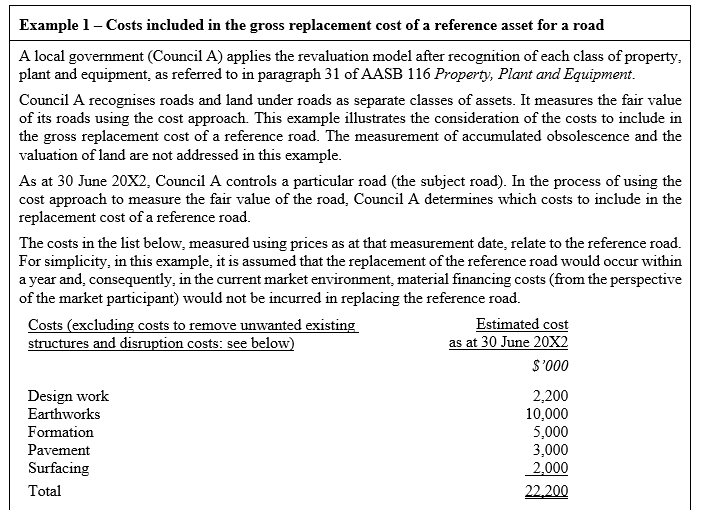
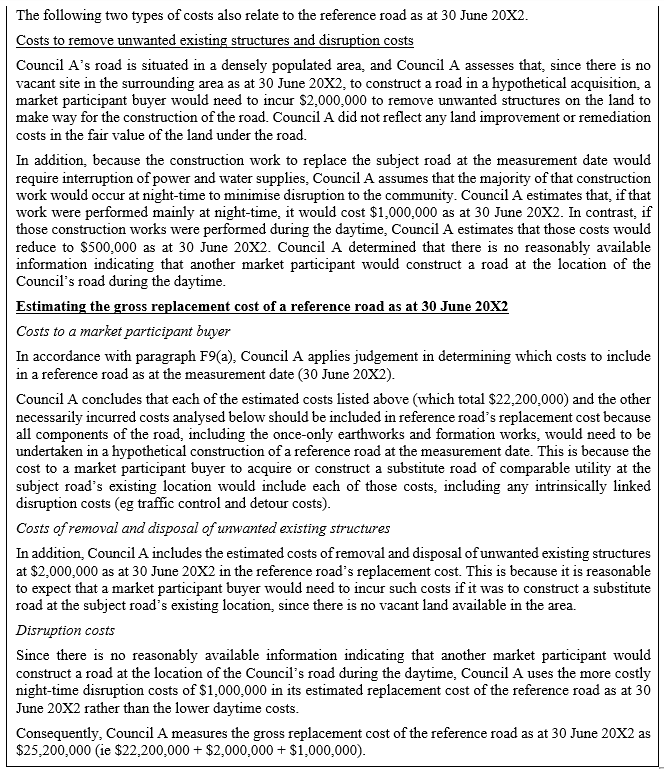
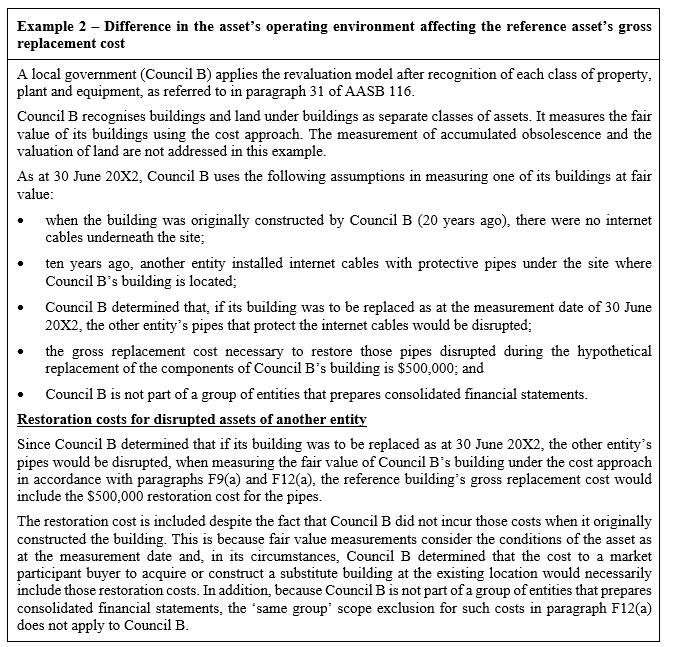
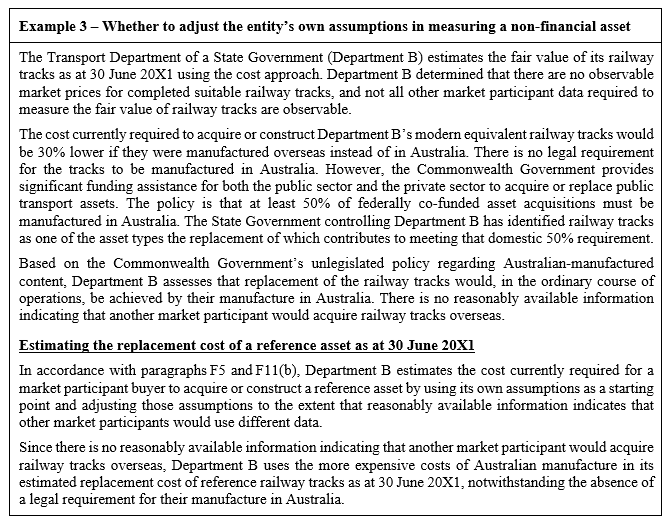
Examples 1–4 illustrate the costs included in the replacement cost of a reference asset for the purpose of measuring the fair value of a non-financial asset not held primarily for its ability to generate net cash inflows under the cost approach in accordance with paragraphs B8 and B9, and in paragraphs F9(a) and F11–F15.
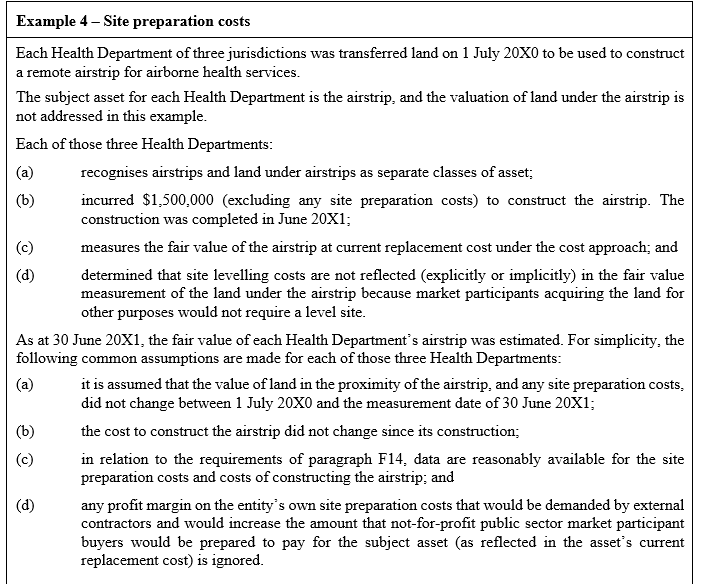
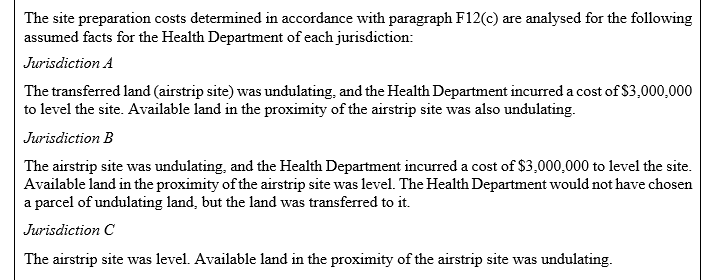
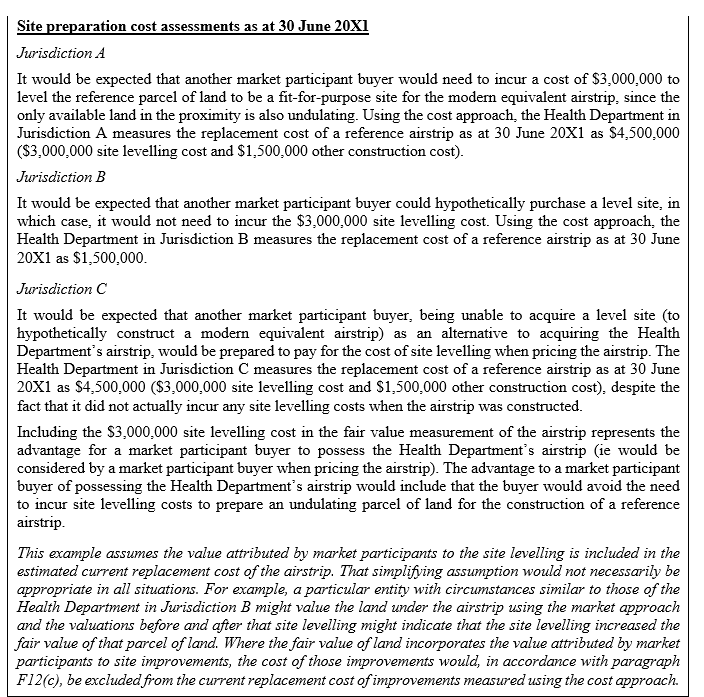
Site preparation costs (paragraph F12(c))
IE3
In respect of a non-financial asset not held primarily for its ability to generate net cash inflows and measured under the cost approach in paragraphs B8 and B9, Example 4 illustrates how a particular entity treats site preparation costs, in accordance with paragraph F12(c), when measuring the fair value of assets using the cost approach.
Economic obsolescence (paragraphs F16–F19)
IE4
Example 5 illustrates an assessment of whether economic obsolescence should be identified in relation to an asset not held primarily for its ability to generate net cash inflows, if the asset is measured at current replacement cost under the cost approach in paragraphs B8 and B9.

IE4
Example 5 illustrates an assessment of whether economic obsolescence should be identified in relation to an asset not held primarily for its ability to generate net cash inflows, if the asset is measured at current replacement cost under the cost approach in paragraphs B8 and B9.