[The] Illustrative examples
The following examples accompany, but are not part of, AASB 1049.
|
|
|
Page |
|
A |
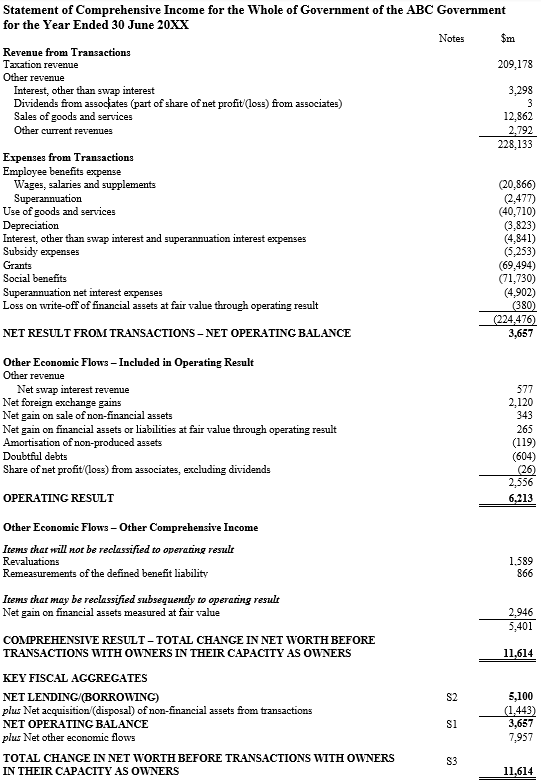
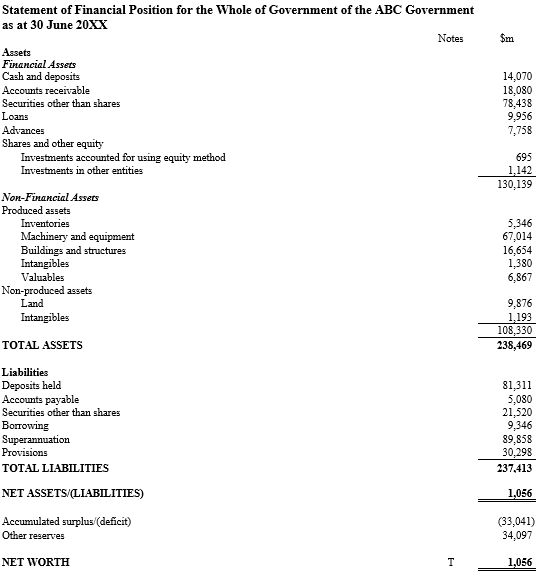
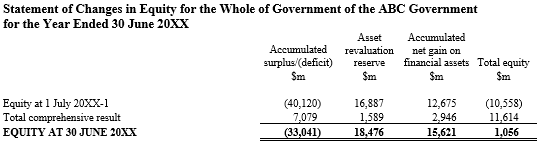
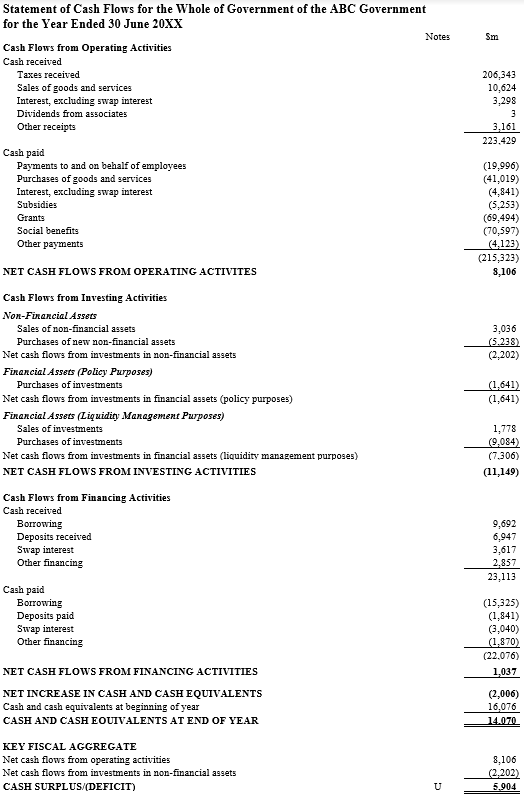
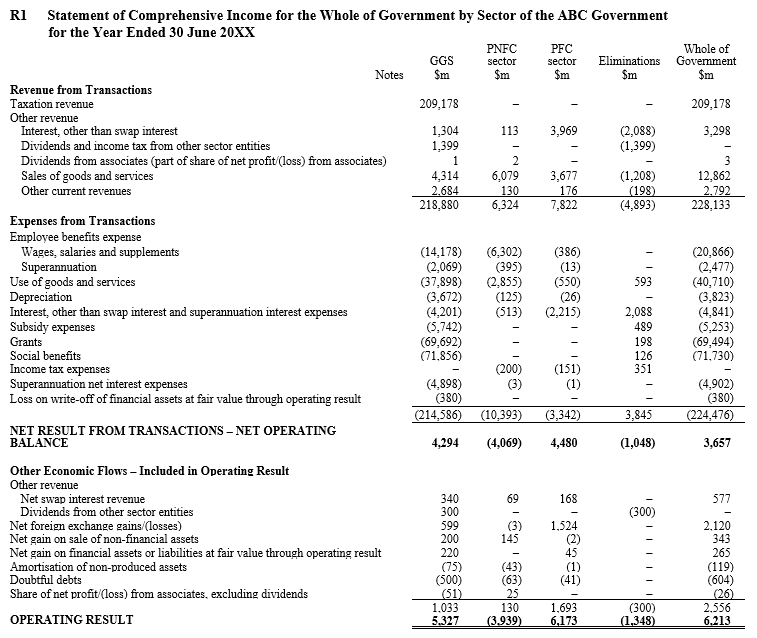
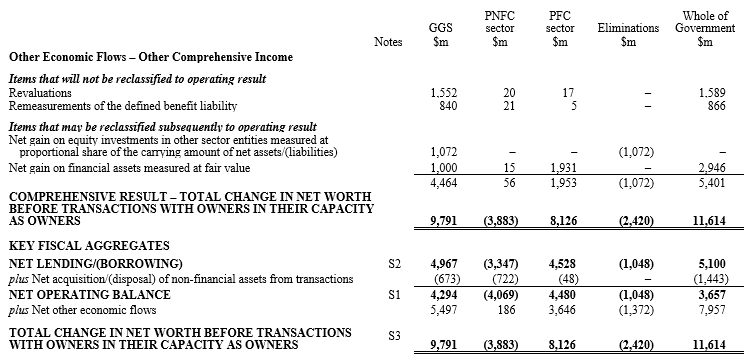
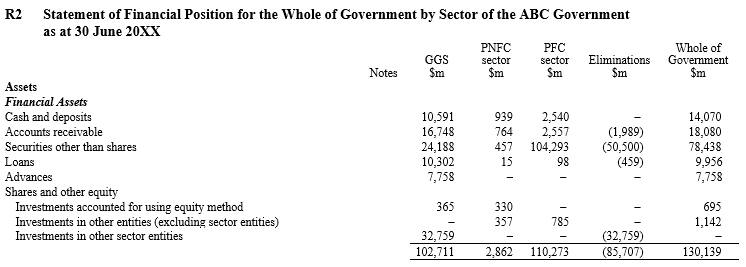
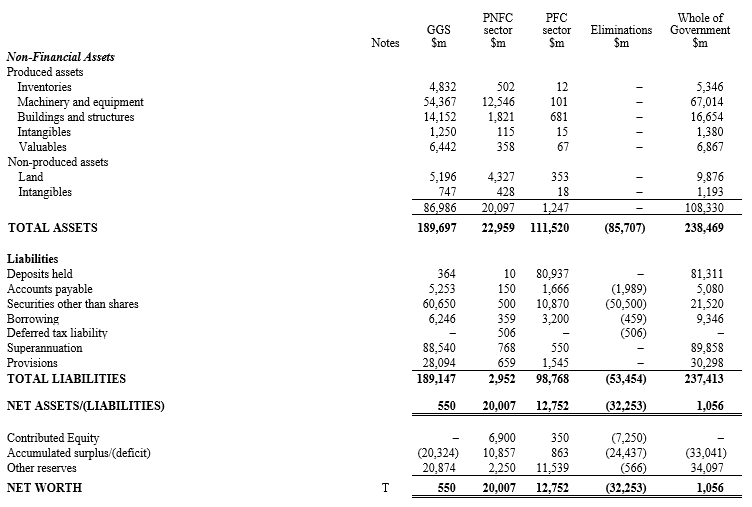
Whole of government statement of comprehensive income, statement of financial position, statement of changes in equity, statement of cash flows and selected notes |
|
|
B |
General Government Sector statement of comprehensive income, statement of financial position, statement of changes in equity, statement of cash flows and selected notes |
|
|
C |
Extract from the note containing the summary of significant accounting policies of a General Government Sector |
|
|
D |
Key technical terms used in the complete sets of financial statements |
70 |
Illustrative Examples A and B provide examples of acceptable formats for whole of government and GGS financial statements respectively, that are consistent with the requirements of this Standard and the assumptions made for the purpose of the illustrations. They also illustrate an acceptable style and format for reconciliation notes and functional information. Furthermore, sector information is illustrated for the whole of government in Illustrative Example A.
The styles and formats illustrated are not mandatory. Other styles and formats may be equally appropriate if they meet the requirements of this Standard.
To assist an understanding of the illustrations, particularly in relation to differences between GAAP and GFS, explanatory notes are provided at the end of Illustrative Example B and relate to both Illustrative Examples A and B. They do not form part of the illustrative financial statements or notes.
Illustrative Examples A and B do not purport to identify all possible differences between GAAP and GFS, nor to present in the financial statements all the line items as might be required by a different set of assumptions. Additionally, they do not illustrate the disclosure of comparative period information or the notes required by paragraphs 39[1] , 41 (except the relevant reconciliation notes)[2] , 52(a) and the explanation of differences required by 52(b)(ii)(B). They also do not illustrate all the disclosures required by other Australian Accounting Standards, such as the disclosure of budgetary information required by AASB 1055 Budgetary Reporting.
The amounts used are based on assumptions made for illustrative purposes only.
Illustrative Example C provides an example of the information to be included in the summary of significant accounting policies of the GGS in accordance with paragraph 39(b).
Illustrative Example D provides an example of the information to be included in the other explanatory notes of the whole of government and GGS regarding explanations of key technical terms in accordance with paragraph 41(a)(iii).
Illustrative example A
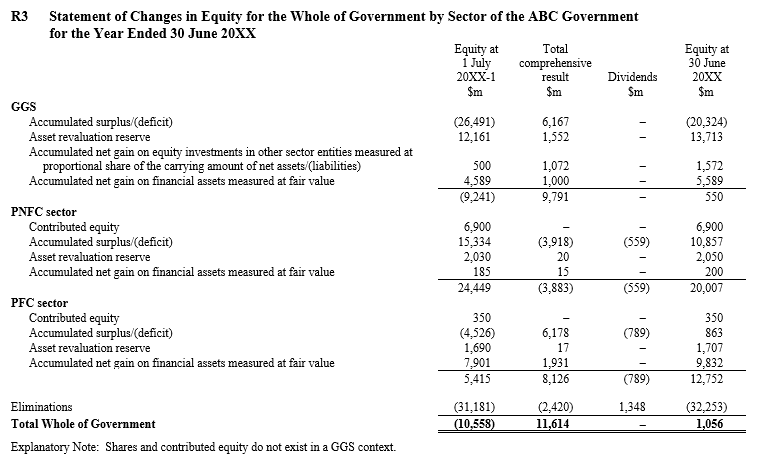
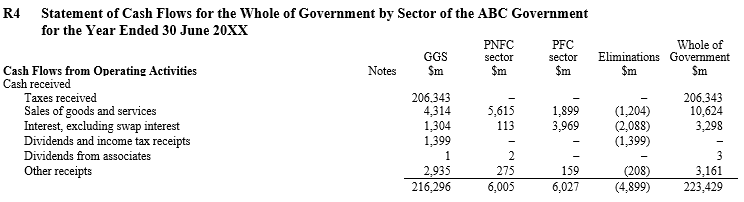
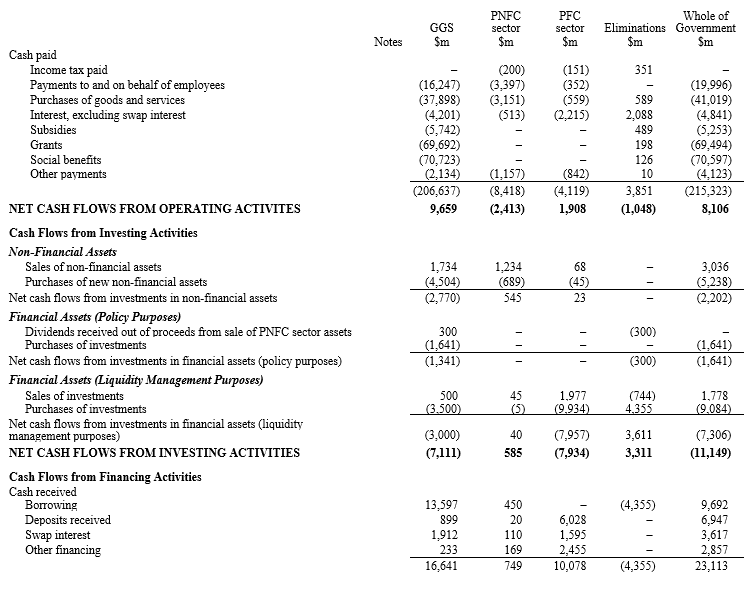
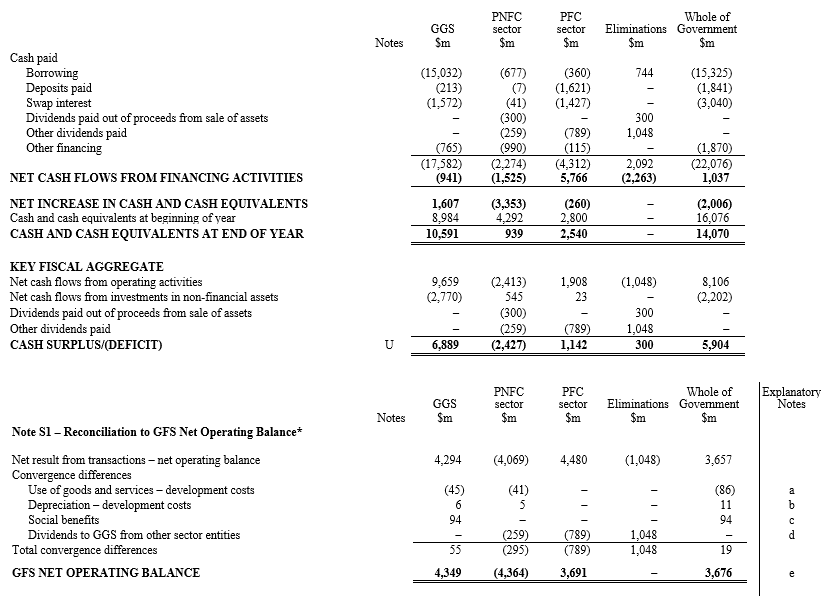
Whole of government statement of comprehensive income, statement of financial position, statement of changes in equity, statement of cash flows and selected notes
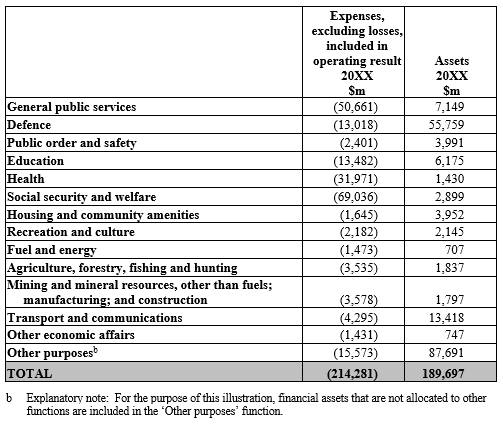
Disaggregated information
Z Functional Classification for Whole of Government
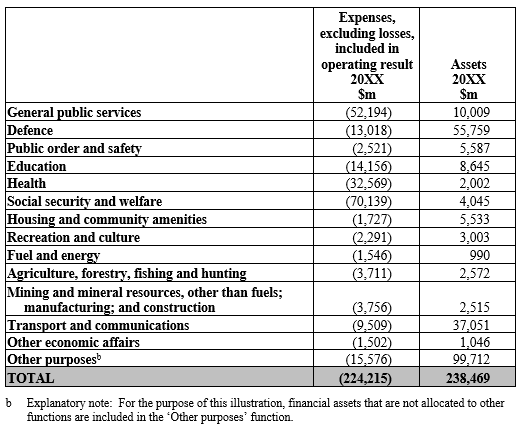
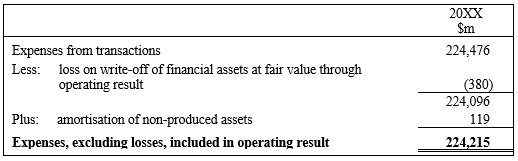
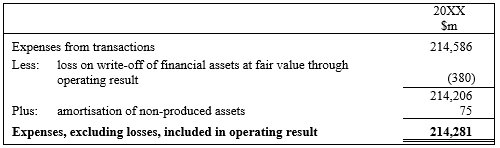
Reconciliation of ‘expenses, excluding losses, included in the operating result’ to ‘expenses from transactions’ in the statement of comprehensive income
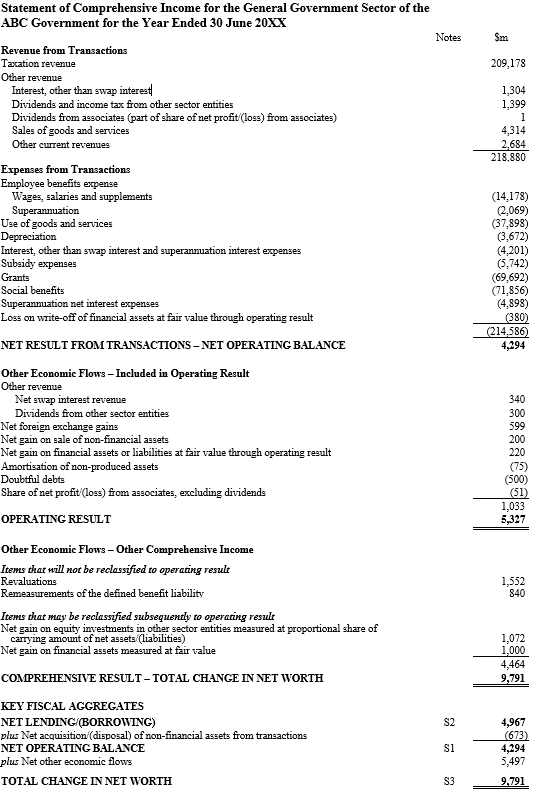
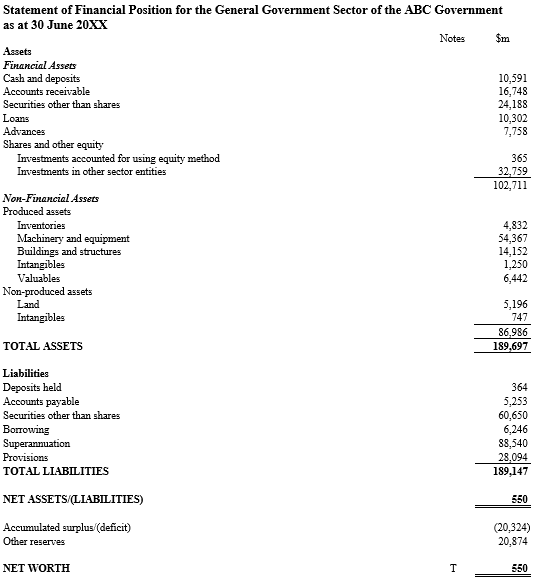
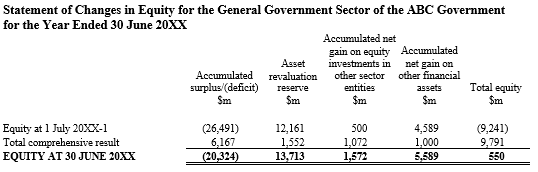
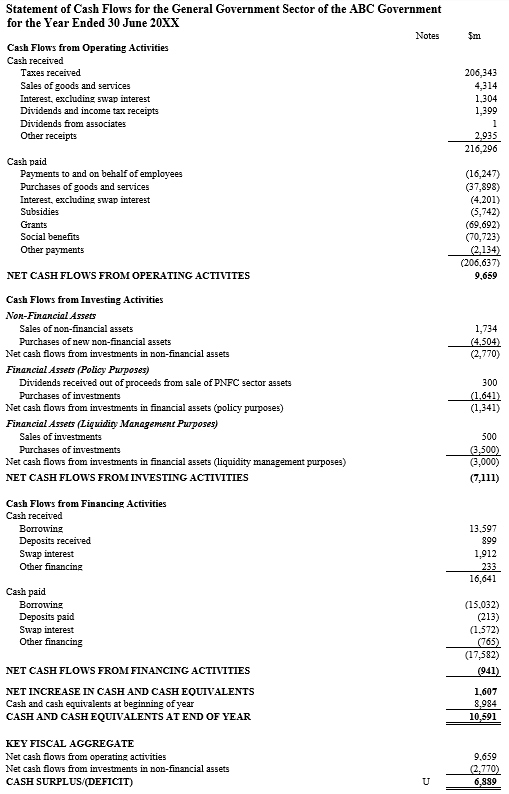
Illustrative example B
General Government Sector statement of comprehensive income, statement of financial position, statement of changes in equity, statement of cash flows and selected notes
Disaggregated information
Z Functional Classification for General Government Sector
Reconciliation of ‘expenses, excluding losses, included in operating result’ to ‘expenses from transactions’ in the statement of comprehensive income
Explanatory notes supporting illustrative examples A and B
The following notes are for explanatory purposes only, and do not form part of the financial statements or accompanying notes illustrated in Illustrative Examples A or B.
The notes provide explanations of the convergence differences between the key fiscal aggregates presented in each of the financial statements and GFS measures of the key fiscal aggregates for the whole of government (including the sectors) and GGS.
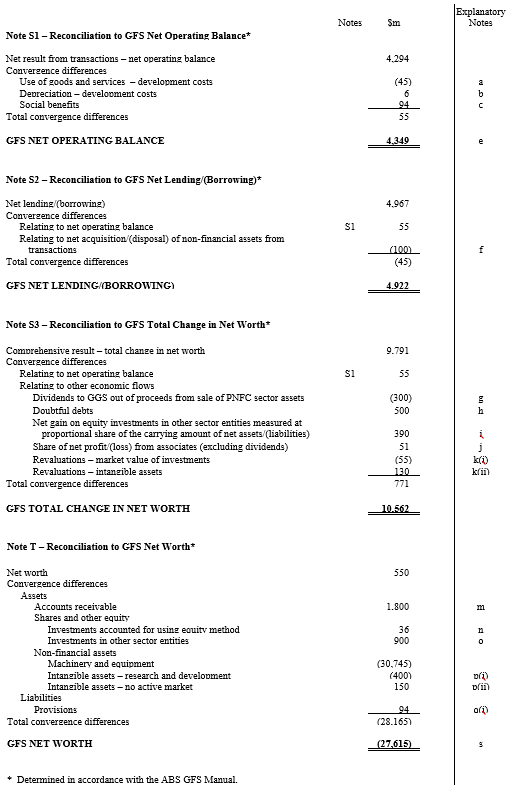
Convergence differences relating to the statements of comprehensive income
Net operating balance
a
Expenses from Transactions – Use of Goods and Services
The convergence difference of ($45m) in the GGS and ($41m) in the PNFC sector arises because GFS expenses certain development costs and classifies them as expenses from transactions. However, the development costs are not recognised as expenses from transactions in the statement of comprehensive income because they are recognised as intangible assets upon acquisition. GFS treats goods and services used for research and development as use of goods and services expenses from transactions, rather than as acquisitions of intangible assets, even though some development activities are expected to bring benefits for more than one year (refer also to Note (b)).
The total difference of ($86m) flows through to the whole of government amounts.
b
Expenses from Transactions – Depreciation
The convergence difference of $6m in the GGS and $5m in the PNFC sector arises because GFS recognises a smaller amortisation of produced intangibles than is recognised as an expense from transactions in the statement of comprehensive income. GFS treats goods and services used for research and development as use of goods and services expense from transactions, rather than as acquisitions of intangible assets, even though some development activities may bring benefits for more than one year (refer also to Note (a)).
The total difference of $11m flows through to the whole of government amounts.
c
Expenses from Transactions – Social Benefits
The convergence difference of $94m in the GGS arises because GFS does not recognise a liability relating to the potential beneficiaries of a social benefit scheme who had not registered for benefits as at the reporting date. Therefore, GFS does not recognise the associated expense from transactions, whereas such an amount is recognised in the statement of comprehensive income and classified as expenses from transactions.
This difference flows through to the whole of government amounts.
d
Dividends to GGS from Other Sector Entities
The convergence difference comprises ($259m) in the PNFC sector and ($789m) in the PFC sector because GFS treats dividends to owners as an expense, whereas such an amount is not recognised as an expense in the statement of comprehensive income because it is treated as a distribution to owners and therefore a direct debit to equity.
The total difference of ($1,048m) does not flow through to the whole of government amounts as it arises from intersector transactions.
e
Other Differences Included in the GFS Net Operating Balance
A classification difference arises in the whole of government and the GGS, because GFS classifies the debt security written off by mutual agreement of $380m as a capital grant expense from transactions, whereas, although it is recognised as an expense from transactions in the statement of comprehensive income, it is classified as loss on write-off of financial assets at fair value through operating result. [For the purpose of Illustrative Examples A and B, the debt security is assumed to have satisfied the criteria in AASB 9 Financial Instruments for classification as a ‘fair value through profit or loss’ financial asset.] The write-off arose from the Government agreeing to forgive the outstanding debt of a Country. The classification difference has no impact on the amount of the GFS Net Operating Balance.
A GGS/PNFC elimination difference arises in respect of the treatment of $25m of the social benefits. Under GFS, certain transactions between the GGS and entities within the PNFC and PFC sectors are not eliminated on consolidation, whereas under AASB 10 Consolidated Financial Statements intragroup transactions that are not in substance transactions with external parties are eliminated in full. The GFS treatment has the effect of ‘grossing up’ both GFS ‘revenue from transactions – other current revenues’ and GFS ‘expenses from transactions – grants’ of the whole of government by equal amounts even though the key fiscal aggregates remain the same. [For the purpose of this illustration, it is assumed the GGS has compensated a PNFC entity for $25m of community service obligations, imposed by the GGS, that requires the PNFC entity to provide free services to a cohort of private individuals.] The compensation provided by the GGS to the PNFC entity is not eliminated under GFS (instead it is ‘rerouted’ through the household sector of the economy and therefore treated as an expense of the GGS to the household sector, and an expense of the household sector to the PNFC entity and therefore revenue of the PNFC entity). This convergence difference has no impact on the amount of the whole of government’s GFS Net Operating Balance. This difference does not affect the GGS or the PNFC and PFC sectors but impacts the total of revenues and expenses in the whole of government statement of comprehensive income.
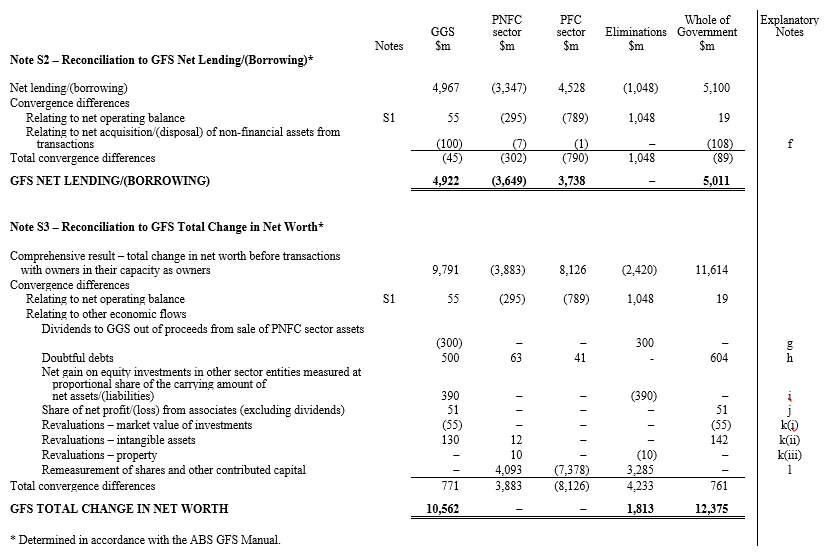
Net lending/(borrowing)
f
Net Acquisition/(Disposal) of Non-Financial Assets from Transactions
The convergence differences are explained as follows:
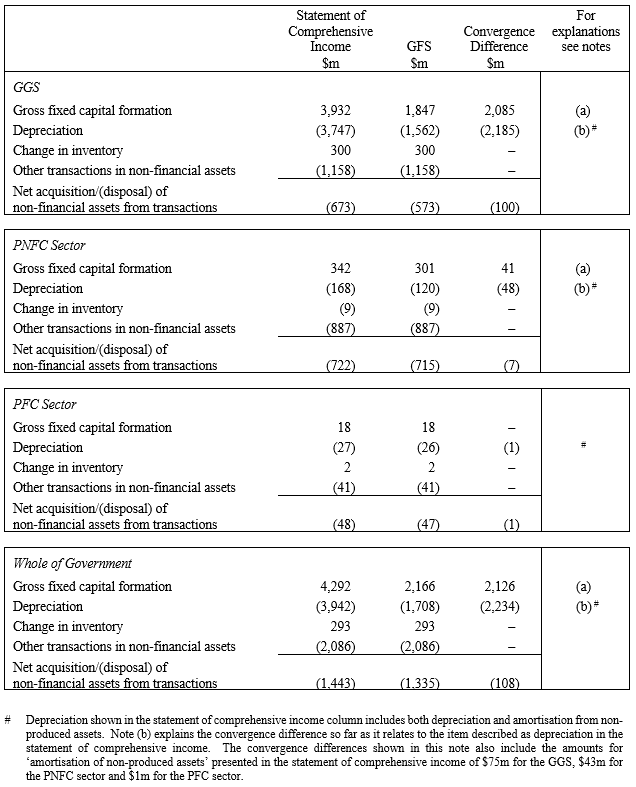
f
Net Acquisition/(Disposal) of Non-Financial Assets from Transactions
The convergence differences are explained as follows:
Net other economic flows
g
Other Economic Flows – Included in Operating Result – Other Revenue – Dividends to GGS from the sale of PNFC sector assets
The convergence difference of ($300m) arises in the GGS because GFS classifies $300m of the distributions from other sector entities as a transaction in financial assets (that is, as a withdrawal of equity because it is funded from proceeds from sale of assets), whereas the statement of comprehensive income recognises it as dividend revenue and classifies it as other economic flows (refer also to Note i).
This difference does not flow through to the whole of government amounts as it arises from intersector transactions.
h
Other Economic Flows – Included in Operating Result – Doubtful Debts
The convergence differences of $500m in the GGS, $63m in the PNFC sector and $41m in the PFC sector arise because GFS does not recognise doubtful debts, whereas the statement of comprehensive income recognises doubtful debts and classifies it as other economic flows. In this example, no bad debts were written off from doubtful debts. GFS recognises amounts written off when there is mutual agreement with debtors as capital grants expenses in the period of the write-off, and recognises those written off unilaterally by the government as other economic flows also in the period of the write-off.
The total difference of $604m flows through to the whole of government amounts.
i
Other Economic Flows – Other Comprehensive Income – Net Gain on Equity Investments in Other Sector Entities Measured at Proportional Share of the Carrying Amount of Net Assets/(Liabilities)
The convergence differences comprise:
$90m in the GGS: The carrying amount of net assets (and therefore the change in carrying amount of net assets) of other sector entities determined under GFS principles and rules differs from the carrying amount of net assets (and therefore the change in carrying amount of net assets) of the subsidiaries recognised in the statement of financial position (being the carrying amount of net assets determined before elimination of intersector balances).
The difference is therefore equivalent to the total of those convergence differences affecting the total change in net worth impacting either through the net operating balance (itemised in Note S1 of Illustrative Example A) or other economic flows (other than transactions with owners in their capacity as owners in the form of dividends paid – itemised in Note S3 of Illustrative Example A). The components are:
|
|
$m |
|
Use of goods and services – development costs [PNFC] |
(41) |
|
Depreciation – development costs [PNFC] |
5 |
|
Doubtful debts [PNFC] |
63 |
|
Doubtful debts [PFC] |
41 |
|
Revaluations – intangible assets [PNFC] |
12 |
|
Revaluations – property [PNFC] |
10 |
|
TOTAL |
90 |
$300m in the GGS: GFS treats this amount as a distribution from other sector entities classified as a transaction in financial assets (that is, as a withdrawal of equity because it is funded from proceeds from sale of assets), whereas the statement of comprehensive income recognises it as dividend revenue and classifies it as other economic flows (refer also to Note g). Under GFS, the holding gain on other sector entities is determined after taking into account additions to and withdrawals from equity that have occurred.
The total difference of $390m does not flow through to the whole of government amounts as it arises from intersector items.
j
Other Economic Flows – Included in Operating Result – Share of Net Profit/(Loss) from Associates (Excluding Dividends)
The convergence difference of $51m arises in the GGS because GFS does not recognise the share of the associate’s loss (excluding dividends), whereas consistent with the equity method of accounting, it is recognised as an expense of $51m and classified as an other economic flow and dividends are recognised as a revenue of $1m and classified as a transaction in the statement of comprehensive income. GFS recognises the decrease in the market value of investments in associates of $55m as an other economic flow (refer to Note k(ii)), and the dividends on such investments of $1m as dividend revenue from transactions.
This difference flows through to the whole of government amounts.
k
Other Economic Flows – Other Comprehensive Income – Revaluations
The convergence differences comprise:
k(i)
($55m) in the GGS because GFS recognises the decrease in the market value of investments in associates of $55m as an other economic flow, whereas it is not recognised in the statement of comprehensive income. Consistent with the equity method of accounting, the statement of comprehensive income recognises the share of the associate’s loss of $50m as a loss of $51m classified as other economic flows and revenue (from dividends) of $1m (refer also to Note j).
This difference flows through to the whole of government amounts.
k(ii)
$130m in the GGS and $12m in the PNFC sector because GFS recognises the net increase in the revalued intangible assets as an other economic flow, whereas it is not recognised in the statement of comprehensive income. In accordance with paragraph 81 of AASB 138 Intangible Assets, the intangible assets in this example are not revalued because there is no active market for them.
The total difference of $142m flows through to the whole of government amounts.
k(iii)
$10m in the PNFC sector because while GFS recognises the gross increase in the revalued asset (in Illustrative Example A, assumed to have arisen from an upward asset revaluation of properties), it does not recognise as an offset part of the increase in the revalued asset as being due to a corresponding increase in the deferred tax liability. (Refer also to Note q(ii))
This difference does not flow through to the whole of government amounts as the whole of government does not have a deferred tax liability.
l
Remeasurement of Shares and Other Contributed Capital
The convergence differences of $4,093m in the PNFC sector and ($7,378m) in the PFC sector arise because GFS measures net worth as assets less liabilities less share capital/contributed capital (remeasured). Because in Illustrative Example A PNFC and PFC sectors are 100 per cent owned by the GGS, the GFS net worth, and therefore the GFS change in net worth, of these sectors is zero. In effect, all of the convergence differences that impact on the comprehensive result are netted off for the PNFC and PFC sectors against the GFS remeasurement of shares and other contributed capital.
The total difference of ($3,285m) does not flow through to the whole of government amounts as they relate to the GGS ownership interest in PNFC/PFC sectors.
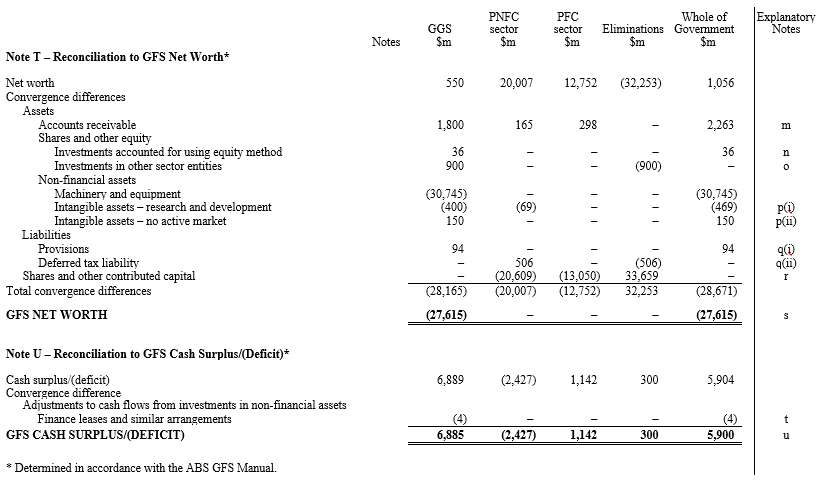
Convergence differences relating to the statements of financial position
Net worth
m
Assets – Financial Assets – Accounts Receivable
The convergence differences of $1,800m in the GGS, $165m in the PNFC sector and $298m in the PFC sector arise because GFS does not recognise doubtful debts, whereas a provision for doubtful debts is recognised in the statement of financial position.
This total difference of $2,263m flows through to the whole of government amounts.
n
Assets – Financial Assets – Shares and Other Equity – Investments Accounted for Using Equity Method
The convergence difference of $36m arises in the GGS because GFS recognises the net decrease in the market value of investments in associates, whereas the equity method of accounting is applied in the calculation of the carrying amount recognised in the statement of financial position.
This difference flows through to the whole of government amounts.
o
Assets – Financial Assets – Shares and Other Equity – GGS Investments in Other Sector Entities
The convergence difference of $900m arises in the GGS in relation to the measurement of equity investments in other sector entities measured at proportional share of the carrying amount of net assets/(liabilities), due to different definition, recognition and measurement principles and rules for certain assets and liabilities under GFS.
The difference is therefore equivalent to the total of those convergence differences affecting Net Worth (as itemised in Note T). The components are:
|
|
$m |
|
Amounts receivable [PNFC] |
165 |
|
Amounts receivable [PFC] |
298 |
|
Intangible assets – research and development [PNFC] |
(69) |
|
Deferred tax liability [PNFC] |
506 |
|
TOTAL |
900 |
This difference does not flow through to the whole of government amounts as it arises from an intersector item.
p
Assets – Non-Financial Assets – Produced Assets – Intangibles
The convergence differences comprise:
p(i)
($400m) in the GGS and ($69m) in the PNFC sector because GFS treats research and development costs as use of goods and services expenses from transactions, whereas some are treated as acquisitions of intangible assets for the statement of financial position because some development activities are expected to bring benefits for more than one year.
This total difference of ($469m) flows through to the whole of government amounts.
p(ii)
$150m in the GGS because GFS recognises the revaluation of certain intangible assets, whereas those intangible assets have not been revalued in the statement of financial position because there is no active market (in accordance with paragraph 81 of AASB 138).
This difference flows through to the whole of government amounts.
q
Liabilities – Provisions
The convergence differences comprise:
q(i)
$94m in the GGS because GFS does not recognise certain provisions that are recognised in the statement of financial position as liabilities (for example, to the extent that they arise from constructive obligations for which there is no counterparty recognising a related financial asset).
This difference flows through to the whole of government amounts.
q(ii)
$506m in the PNFC sector because GFS does not recognise the deferred tax liability.
This difference does not flow through to the whole of government amounts as it arises from a PNFC sector liability that is not a whole of government liability.
[Note: Depending on the arrangements operating in a particular jurisdiction, a GGS, as an income tax collector, may not be able to recognise a related revenue unless it meets the criteria in AASB 1058 Income of Not-for-Profit Entities. Under the tax regime assumed for the purpose of this example, the GGS, as the tax collector, does not recognise deferred tax balances because the tax events associated with the PNFC sector’s deferred tax balances have not occurred, even though from the PNFC sector’s viewpoint, the event is the recognition of the underlying assets and/or liabilities in accordance with AASB 112 Income Taxes. This treatment in the GGS accords with GFS, which does not recognise deferred tax assets. Therefore, no convergence difference arises.]
r
Shares and Other Contributed Capital
The convergence differences of ($20,609m) in the PNFC sector and ($13,050m) in the PFC sector arise because GFS measures net worth as assets less liabilities less shares/contributed capital, whereas shares/contributed capital are not deducted in the determination of GAAP net worth. Because in this example GFS measures shares/contributed capital of the PNFC and PFC sectors at the carrying amount of net assets of those sectors, PNFC and PFC sector GFS net worth is nil.
The total difference of ($33,659m) does not flow through to the whole of government amounts as they relate to the GGS ownership interest in the PNFC and PFC sectors.
s
Classification Difference Included in the GFS Net Worth
A classification difference arises in the GGS because GFS classifies $28,000m of the $28,094m of provisions as other accounts payable. The classification difference has no impact on the amount of the GFS Net Worth.
This difference flows through to whole of government amounts.
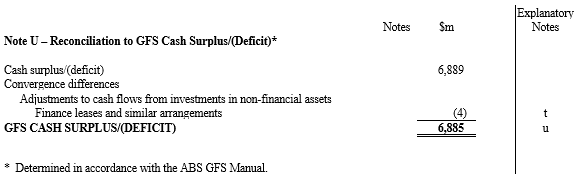
Convergence differences relating to the statements of cash flows
Cash surplus/(deficit)
t
Cash Flows from Investments in Non-Financial Assets
The convergence difference of ($4m) in the GGS arises because GFS recognises a notional cash outflow relating to new finance leases and similar arrangements in calculating cash surplus/(deficit), whereas the statement of cash flows does not recognise notional cash flows.
This difference flows through to the whole of government amounts.
u
Classification Differences Included in the GFS Cash Surplus/(Deficit)
For the whole of government and GGS, amounts of $41,019m and $37,898m respectively have been recognised as payments for purchases of goods and services from operating activities in the statement of cash flows. Under GFS, the corresponding amounts are $41,105m and $37,943m respectively.
The convergence difference of $45m in the GGS is due to capitalised development costs that are classified as purchases of non-financial assets – which are investing activities in the statement of cash flows.
For the PNFC sector, an amount of $3,151m has been recognised as payments for purchases of goods and services from operating activities in the statement of cash flows. Under GFS, the corresponding amount is $3,192m.
The convergence difference of $41m comprises capitalised development costs that are classified as purchases of non-financial assets – which are classified as investing activities in the statement of cash flows.
The total convergence difference of $86m flows through to whole of government.
These classification differences have no impact on the amount of the GFS Cash Surplus/(Deficit).
Illustrative example C
Extract from the note containing the summary of significant accounting policies of a General Government Sector
The following is an example of an extract from Note 1 of the financial statements for a year subsequent to the first year of adoption of this Standard, consistent with the requirements of paragraph 39. This example assumes that the GGS financial statements are presented separately from the whole of government financial statements, and that the most recent version of the ABS GFS Manual has been applied.
The financial statements of the General Government Sector (GGS) of [name of the Government] have been prepared in accordance with AASB 1049 Whole of Government and General Government Sector Financial Reporting, which requires compliance with all Australian Accounting Standards except those identified below. The purpose of the financial statements is to provide users with information about the stewardship by the Government in relation to its GGS and accountability for the resources entrusted to it; information about the financial position, changes in net assets/(liabilities), performance and cash flows of the Government’s GGS; and information that facilitates assessments of the macro-economic impact of the Government’s GGS.
The GGS of [name of the Government] is a component of the Whole of Government of [name of the Government]. The GGS is determined in accordance with the principles and rules contained in the Australian Bureau of Statistics publications:
(a) Australian System of Government Finance Statistics: Concepts, Sources and Methods, 2005 (ABS Catalogue No. 5514.0); and
(b) Amendments to Australian System of Government Finance Statistics, 2005 (ABS Catalogue No. 5514.0)
published on the ABS website on [publication date, or refer to effective date if specified by the ABS] (ABS GFS Manual). The GGS consists of all government units and non-profit institutions controlled and mainly financed by government. Government units are legal entities established by political processes that have legislative, judicial, or executive authority over other units and which provide goods and services to the community or to individuals on a non-market basis; and make transfer payments to redistribute income and wealth. Non-profit institutions are created for the purpose of producing or distributing goods and services but are not a source of income, profit or other financial gain for the government.
The Standard under which the GGS financial statements are prepared does not require full application of AASB 10 Consolidated Financial Statements and AASB 9 Financial Instruments. Assets, liabilities, income, expenses and cash flows of government controlled entities that are in the Public Non-Financial Corporations sector and the Public Financial Corporations sector are not separately recognised in the GGS of [name of the Government’s] financial statements. Instead, the GGS financial statements recognise an asset, being the controlling equity investment in those entities, and recognise a gain or loss relating to changes in the carrying amount of that asset, measured in accordance with AASB 1049. Readers are referred to the Whole of Government general purpose financial statements of [name of the Government] for the year ended 30 June 20XX for financial information that separately recognises assets, liabilities, income, expenses and cash flows of all entities under the control of the [name of the Government].
The ABS GFS Manual also provides the basis upon which Government Finance Statistics (GFS) information that is contained in the financial statements is prepared. In particular, notes disclosing key fiscal aggregates of net worth, net operating balance, total change in net worth, net lending/(borrowing) and cash surplus/(deficit) determined using the principles and rules in the ABS GFS Manual are included in the financial statements, together with a reconciliation of those key fiscal aggregates to the corresponding key fiscal aggregates recognised in the financial statements.
Illustrative example D
Key technical terms used in the complete sets of financial statements
This illustration provides an example of the presentation of explanations of selected key technical terms used in the Whole of Government and GGS Financial Statements and Selected Notes (Illustrative Examples A and B), as required by paragraph 41(a)(iii) of this Standard.
This illustration presents generic explanations, suitable in both a whole of government and GGS context, except where indicated. In instances where the generic definition is not necessarily appropriate, further guidance has been provided.
Cash surplus/(deficit) is net cash flows from operating activities plus net cash flows from acquisition and disposal of non-financial assets and less distributions paid. GFS cash surplus/(deficit) also deducts the value of assets acquired under finance leases and similar arrangements.
Comprehensive result (total change in net worth before transactions with owners in their capacity as owners)[3] is the net result of all items of income and expense recognised for the period. It is the aggregate of operating result and other comprehensive income, other than transactions with owners in their capacity as owners.
Convergence difference is the difference between the amounts recognised in the financial statements compared with the amounts determined for GFS purposes as a result of differences in definition, recognition, measurement, classification and consolidation principles and rules.
Financial asset is any asset that is:
(a) cash;
(b) an equity instrument of another entity;
(c) a contractual right:
(i) to receive cash or another financial asset from another entity; or
(ii) to exchange financial assets or financial liabilities with another entity under conditions that are potentially favourable to the entity; or
(d) a contract that will or may be settled in the entity’s own equity instruments and is:
(i) a non-derivative for which the entity is or may be obliged to receive a variable number of the entity’s own equity instruments; or
(ii) a derivative that will or may be settled other than by the exchange of a fixed amount of cash or another financial asset for a fixed number of the entity’s own equity instruments. For this purpose the entity’s own equity instruments do not include instruments that are themselves contracts for the future receipt or delivery of the entity’s own equity instruments.
General Government Sector (GGS) is the institutional sector comprising all government units and non-profit institutions controlled and mainly financed by government.
Government Finance Statistics (GFS) enable policymakers and analysts to study developments in the financial operations, financial position and liquidity situation of the government. More details about the GFS can be found in the Australian Bureau of Statistics (ABS) publications Australian System of Government Finance Statistics: Concepts, Sources and Methods, 2005 (ABS Catalogue No. 5514.0) and Amendments to Australian System of Government Finance Statistics, 2005 (ABS Catalogue No. 5514.0) published on the ABS website.
Gross fixed capital formation is the value of acquisition less disposals of new and existing produced assets that can be used in production, other than inventories.
Mutually agreed bad debts are financial assets written off where there was prior knowledge and consent by the counterparties.
Net acquisition/(disposal) of non-financial assets from transactions is gross fixed capital formation less depreciation plus changes in inventories plus other transactions in non-financial assets.
Net actuarial gains includes actuarial gains and losses on defined benefit superannuation plans.
Net cash flows from investments in financial assets (liquidity management purposes) is cash receipts from liquidation or repayment of investments in financial assets for liquidity management purposes less cash payments for such investments. Investment for liquidity management purposes means making funds available to others with no policy intent and with the aim of earning a commercial rate of return.
Net cash flows from investments in financial assets (policy purposes) is cash receipts from the repayment and liquidation of investments in financial assets for policy purposes less cash payments for acquiring financial assets for policy purposes. Acquisition of financial assets for policy purposes is distinguished from investments in financial assets (liquidity management purposes) by the underlying government motivation for acquiring the assets. Acquisition of financial assets for policy purposes is motivated by government policies such as encouraging the development of certain industries or assisting citizens affected by natural disaster.
Net gain on equity investments in other sector entities measured at proportional share of the carrying amount of net assets/(liabilities) comprises the net gains relating to the equity held by the GGS in other sector entities. It arises from a change in the carrying amount of net assets of the subsidiaries. The net gains are measured based on the proportional share of the subsidiary’s carrying amount of net assets/(liabilities) before elimination of intersector balances.
Net lending/(borrowing) is net operating balance minus the net acquisition/(disposal) of non-financial assets. It is also equal to transactions in the net acquisition/(disposal) of financial assets minus the net incurrence of liabilities. It indicates the extent to which financial resources are placed at the disposal of the rest of the economy or the utilisation of financial resources generated by the rest of the economy. It is an indicator of the financial impact on the rest of the economy.
Net other economic flows is the net change in the volume or value of assets and liabilities that does not result from transactions.
Net result from transactions – net operating balance is revenue from transactions minus expenses from transactions. It is a summary measure of the ongoing sustainability of operations. It excludes gains and losses resulting from changes in price levels and other changes in the volume of assets. It is the component of the change in net worth that is due to transactions and can be attributed directly to government policies.
Net worth is assets less liabilities and shares/contributed capital. For the GGS, net worth is assets less liabilities, since shares and contributed capital do not exist in a GGS context[4]. It is an economic measure of wealth and reflects the contribution to the wealth of Australia. The change in net worth is the preferred measure for assessing the sustainability of fiscal activities.
Non-financial assets are all assets that are not ‘financial assets’.
Non-produced assets are assets needed for production that have not themselves been produced. They include land, subsoil assets, and certain intangible assets.
Non-produced intangibles are intangible assets needed for production that have not themselves been produced. They include constructs of society such as patents.
Operating result is a measure of financial performance of the operations for the period. It is the net result of items of revenue, gains and expenses (including losses) recognised for the period, excluding those that are classified as ‘other comprehensive income’.
Other current revenues refers to current revenue other than current revenue from taxes, sales of goods and services, and property income. It includes revenue from fines other than penalties imposed by tax authorities.
Other economic flows – see definition of ‘net other economic flows’ above.
Other sector entities are government controlled entities that are not part of the GGS.
Public Financial Corporations (PFC) sector is the institutional sector comprising resident government controlled corporations and quasi-corporations mainly engaged in financial intermediation or provision of auxiliary financial services.
Public Non-Financial Corporations (PNFC) sector is the institutional sector comprising resident government controlled corporations and quasi-corporations mainly engaged in the production of market goods and/or non-financial services.
Quasi-corporation is an unincorporated enterprise that functions as if it were a corporation, has the same relationship with its owner as a corporation, and keeps a separate set of accounts.
Securities other than shares are negotiable financial instruments serving as evidence of the obligations to settle by means of providing cash, a financial instrument, or some other item of economic value. The security normally specifies a schedule for interest payments and principal repayments. Some examples are: bills, bonds and debentures, commercial paper, and securitised mortgage loans.
Social benefits are transfers in cash or in kind to relieve households of the burden of a defined set of social risks. Social risks are events or circumstances that may adversely affect the welfare of households either by imposing additional demands on their resources or by reducing their incomes.
Transactions are interactions between two units by mutual agreement or an action within a unit that is analytically useful to treat as a transaction.
Unilaterally determined bad debts are financial assets written off without an agreement with the debtor in cases such as bankruptcy of the debtor.
Use of goods and services is the total value of goods and services used in production, and use of goods acquired for resale. Goods and services acquired for use as direct in-kind transfers to households or as grants are excluded.
Valuables are produced goods of considerable value that are acquired and held primarily as stores of value over time and are not used primarily for purposes of production or consumption. They include works of art not used primarily in museums to produce services for the public.
Wages, salaries and supplements consist of all uncapitalised compensation of employees except for superannuation. It includes pay in cash or in-kind.
Whole of government financial statements are financial statements that are prepared in accordance with Australian Accounting Standards, including AASB 10 Consolidated Financial Statements, and thereby separately recognise assets, liabilities, income, expenses, and cash flows of all entities under the control of the government on a line-by-line basis.
Explanatory note: The term ‘transactions with owners in their capacity as owners’ is most pertinent in a whole of government context. Such transactions may occur between the GGS, as owner, and the PNFC/PFC sectors and are therefore required to be disclosed in the sector information included in the whole of government financial statements. In addition, transactions with owners in their capacity as owners may occur in a whole of government context in relation to partly-owned subsidiaries. Accordingly, the GGS financial statements could use the alternative term ‘Comprehensive result (total change in net worth)’ defined as the net result of all items of income and expense recognised for the period. It is the aggregate of operating result and other changes in equity.
Explanatory note: The reference to shares/contributed capital is most pertinent in a whole of government context. As an alternative, the GGS financial statements could define ‘net worth’ as ‘assets less liabilities’ because shares and contributed capital do not exist in a GGS context.